2021
Sellics - Product Dashboard
Introduction
Sellics was a platform for Amazon sellers that offered solutions to help manage their business like advertising automation, profit tracking, and SEO optimization.
The Problem
Tools that provide solutions for Amazon sellers typically offer features for individual areas such as SEO, advertising, or inventory management. Our research showed that users needed more integrated solutions once the pieces in the Amazon ecosystem are all interconnected. For example, actions taken in advertising also have an impact on organic visibility, or out-of-stock items have higher advertising costs after no sales are made.
The target users were the majority of our customer base, small and medium-sized sellers with minimal to no prior experience with advertising.
My Role
- Support PM with workshops, customer interviews, and outcomes analysis.
- Create layouts to solve the problem discovered during research
- Validate the solution with internal and external stakeholders
- Create documentation for development
Challenge
The biggest challenge was to create a visualization that showed the health of the product's performance in a simple and self-explanatory way. To do this, I created a spreadsheet with real data and explored different combinations until I identified the most significant ones. After validation, we moved on with the final solution.
Solution
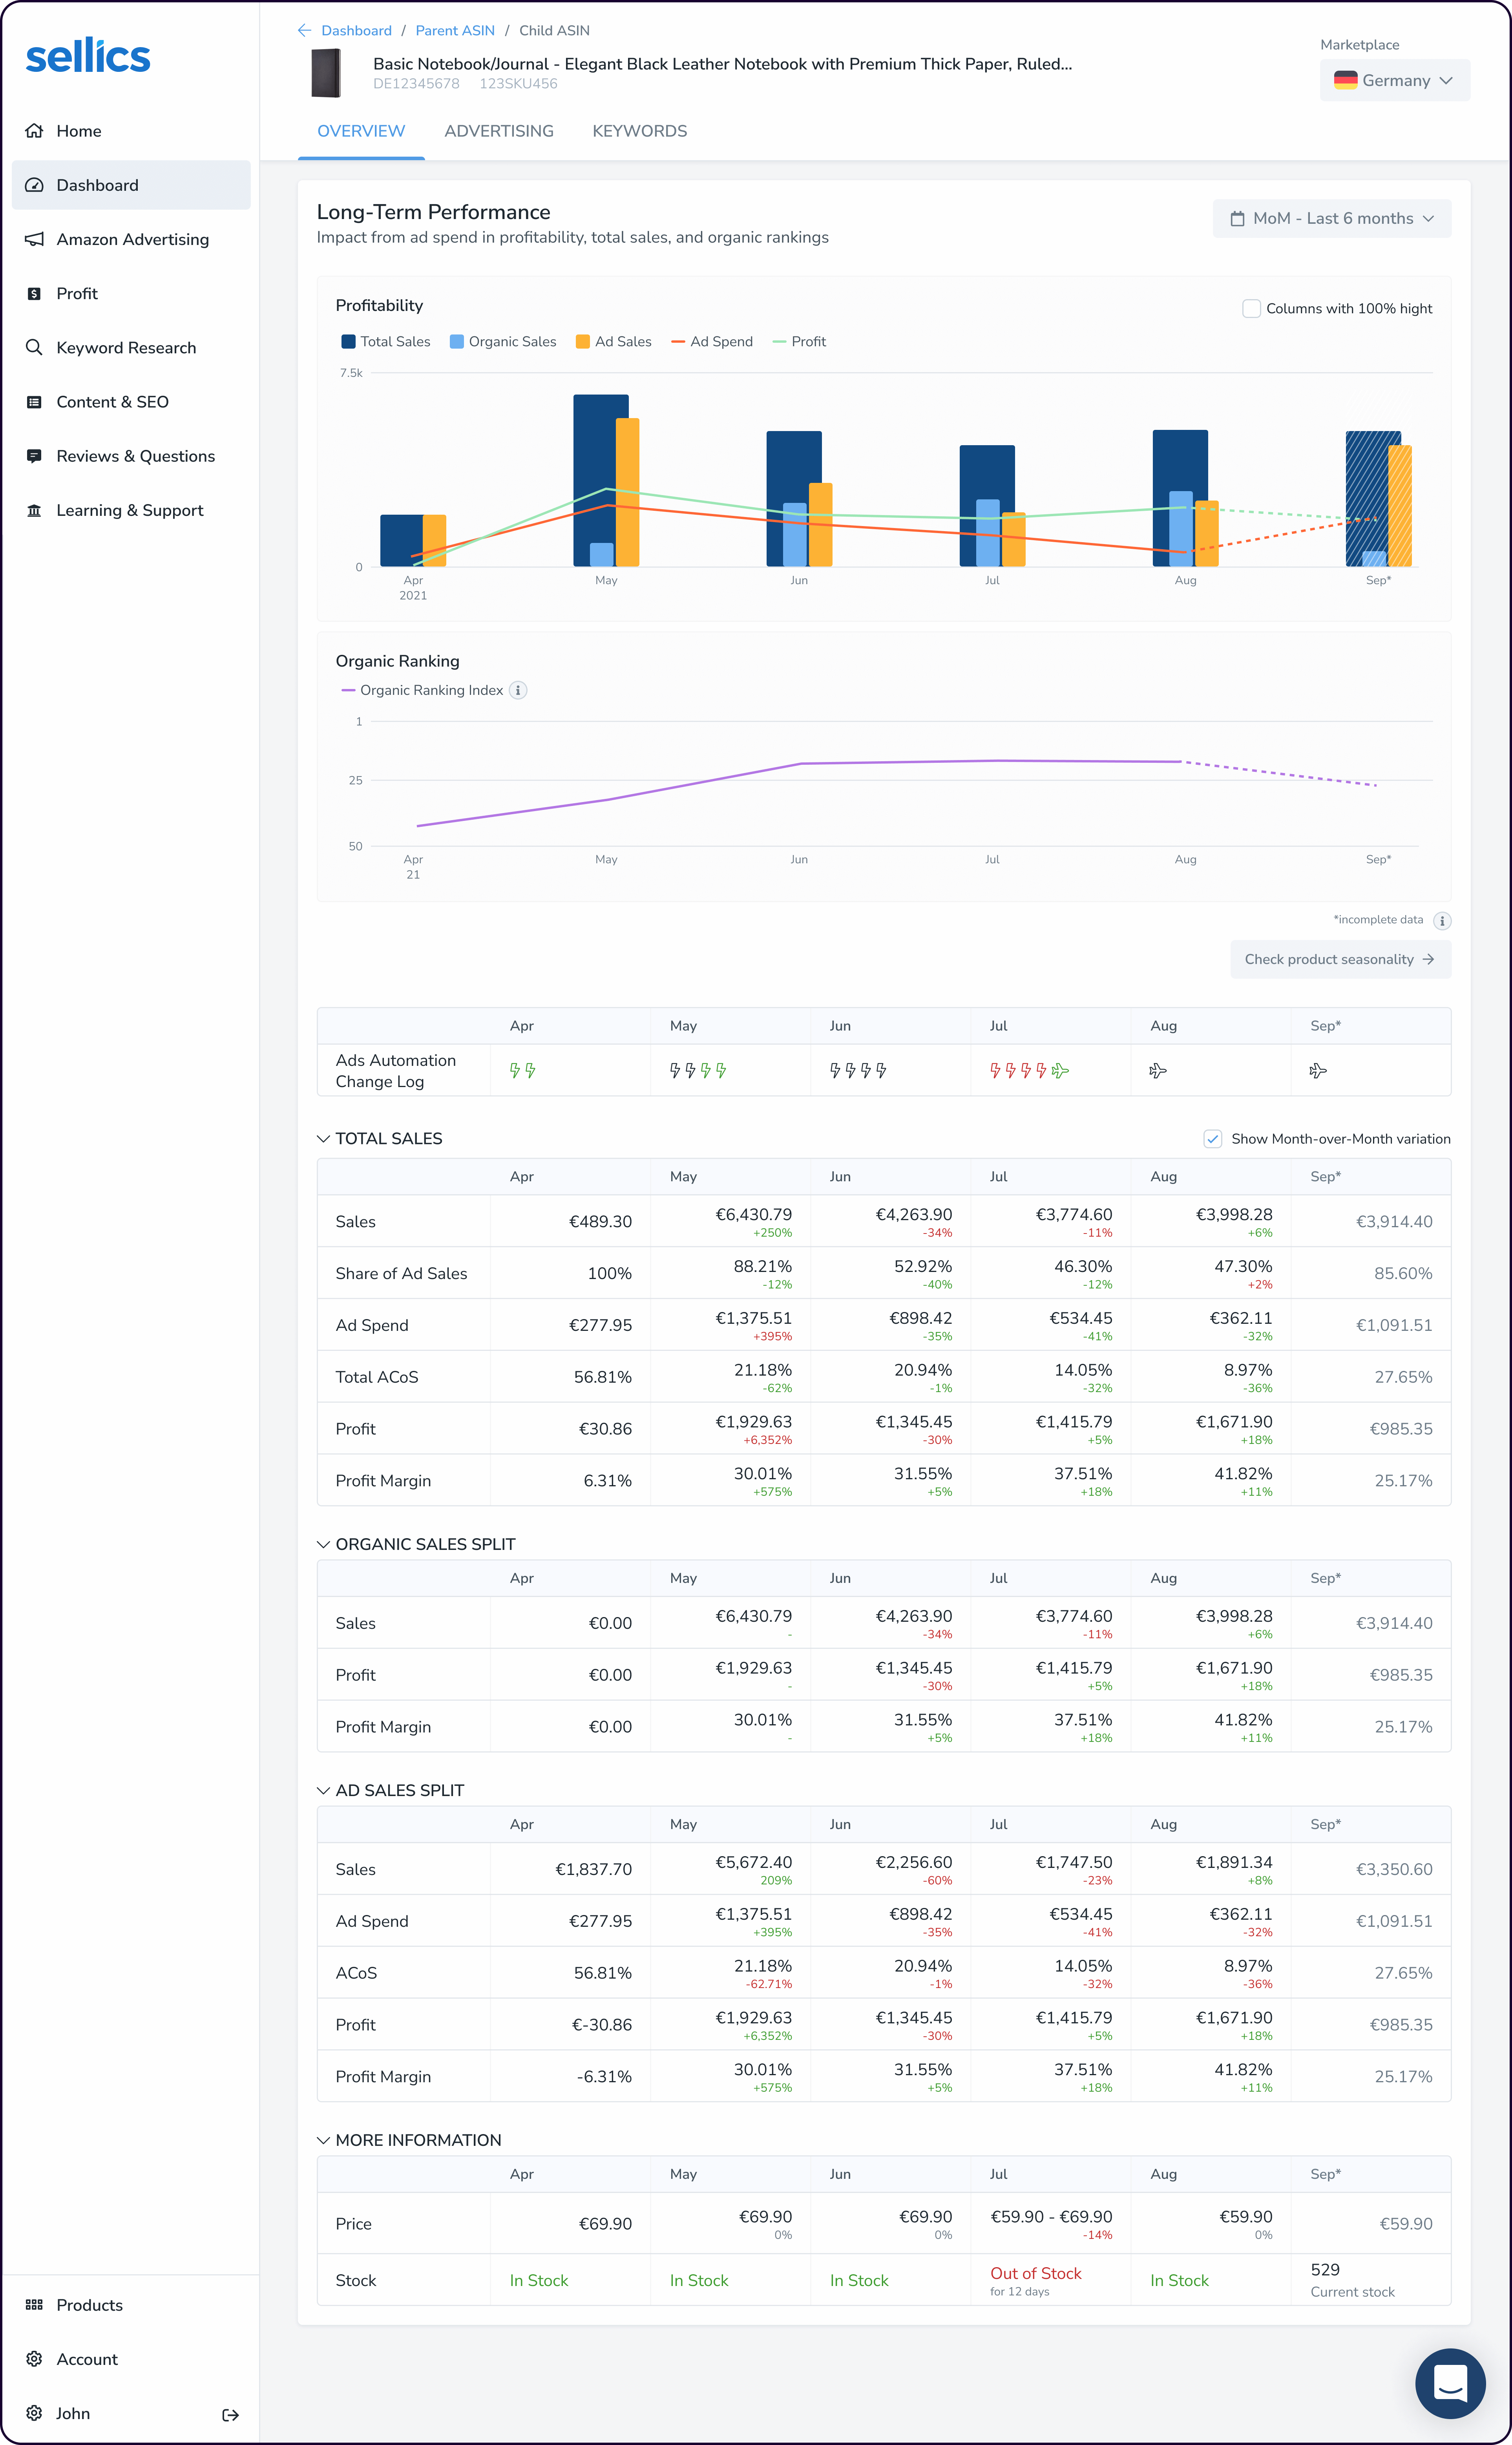
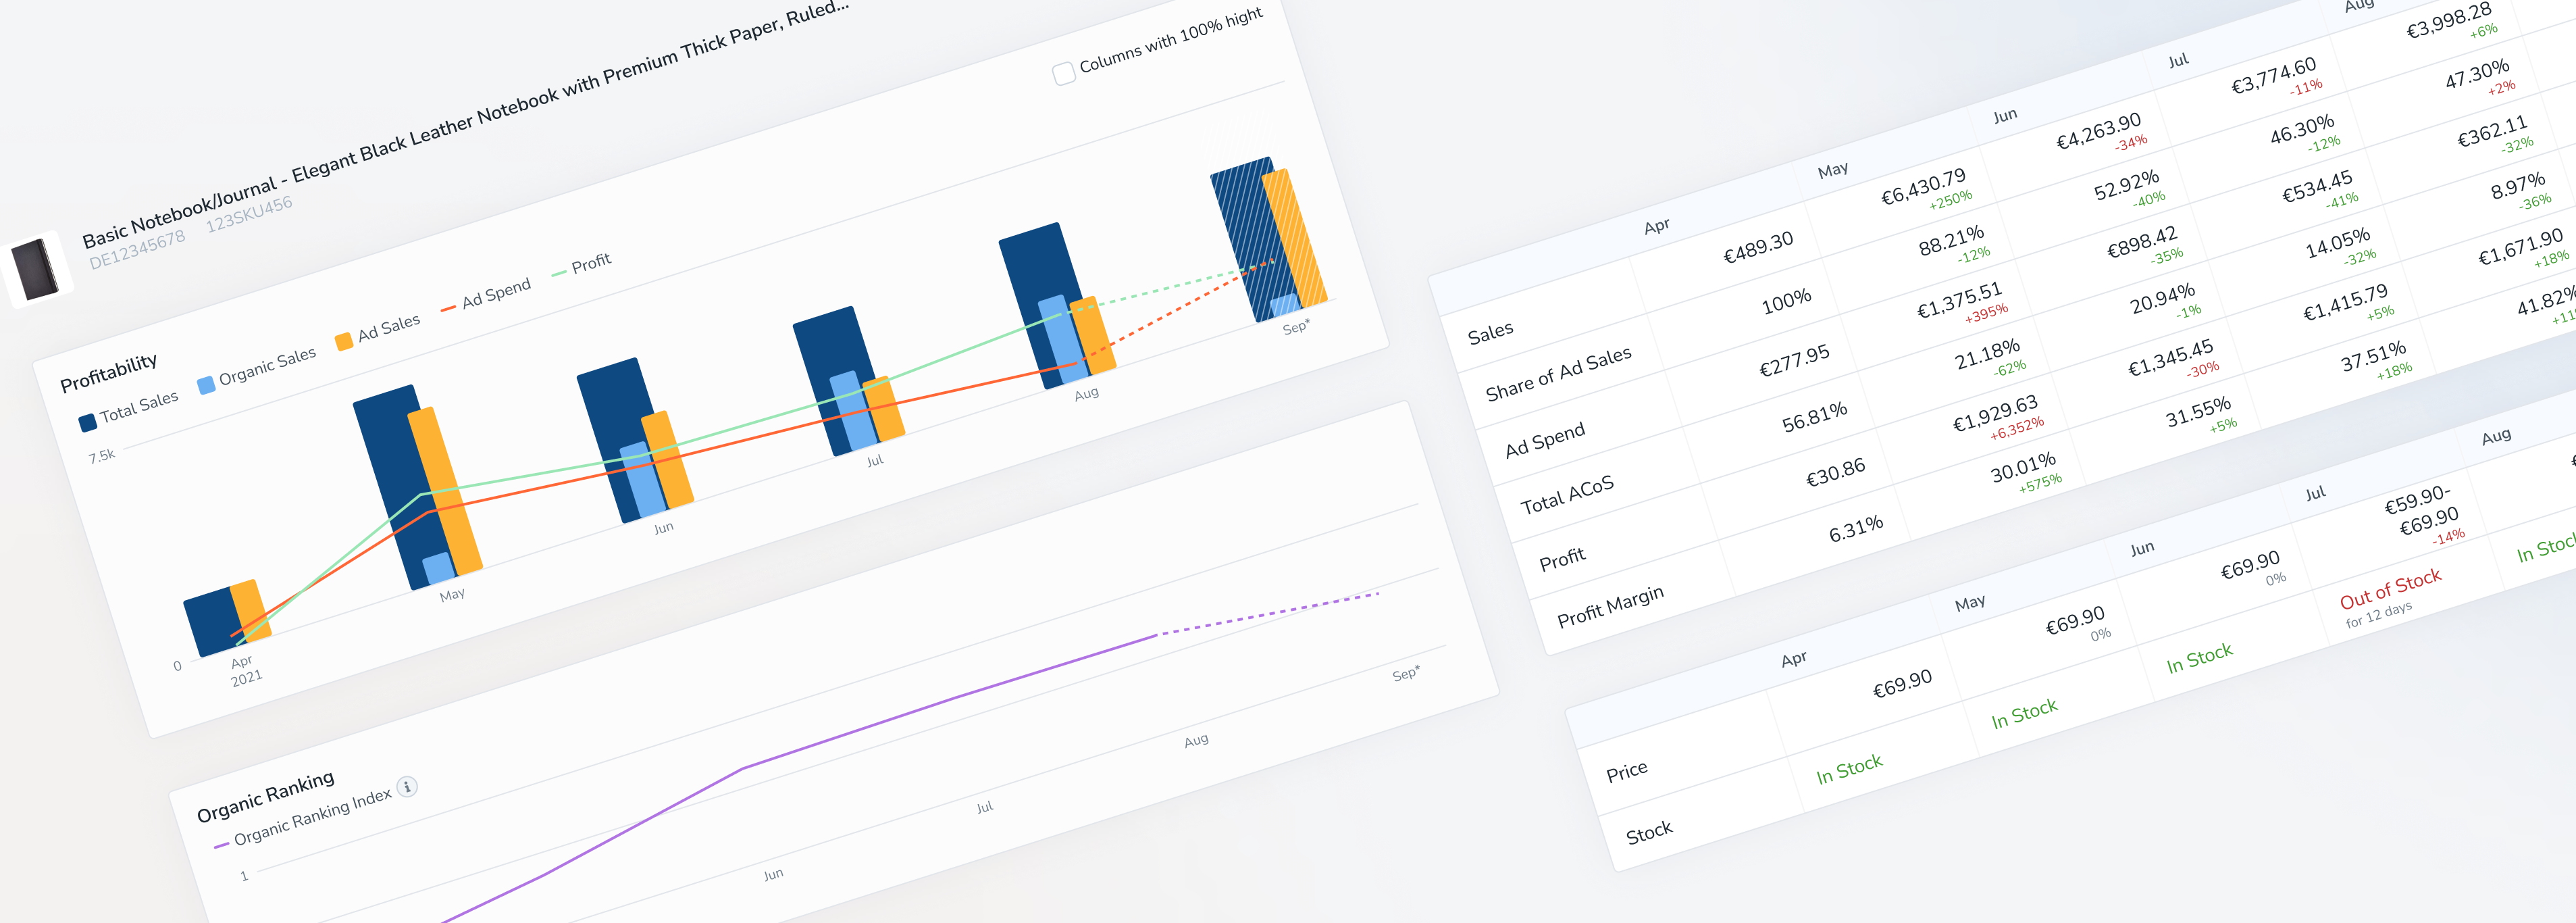
The initial graph provides users with an overview of their product's sales distribution, distinguishing between sales generated through paid advertising and organic sales. This visual breakdown enables users to assess their advertising costs and calculate their overall product profitability. This helps them identify potential issues, such as when ad spending surpasses profit or when ad-generated sales are higher than organic sales.
If users identify a problem, the next graph allows them to compare the trends with the product's overall organic ranking to check if the rankings are falling, which may point that competitors are taking their position in Amazon Search Result Pages, leading to lost sales. For more granular analysis, users can visualize on the tables the breakdown of sales, pricing, and inventory data to understand what could be contributing to the trends.